Geographic Information Systems (GIS) refers to a computer system that collects geographical information and allows us to analyse these spatial datasets. GIS is widely used in map-oriented mobile phone applications that enable us to order food, check traffic data or to navigate. Constantly updated information via GIS assists in long-term weather predictions and efficient traffic management within a city. This tool has a place in the field of wildlife as well, specifically in the avenue of research. Within Wildlife SOS, our team of researchers use this software technology to study and track animals like Sloth bears and elephants. To know how, read on!
The field team of Wildlife SOS carries out their research projects on Sloth bears to identify conflict points in those forested areas that lie on the fringes of human settlements. One way to track the animals’ movement is through radio collars which can transmit their location, and warn people of their proximity. However, it is an impossible task to radio-collar each Sloth bear in a vast forest. Furthermore, the data acquired may be insufficient to understand the behaviour patterns of these animals.
To fulfil their study, researchers also rely on collateral data collected from animal markings using camera traps. Camera traps are set up at multiple locations in the hope of sighting a bear and following its movement. Other visual data gathered include claw marks and scratches on trees, pugmarks, Sloth bear dens, dug-up termite mounds, and animal excrement. These findings require researchers to mark each location coordinate for future reference. The raw data collected still requires time, patience and a standardised methodology to assimilate in order to arrive at desired conclusions. In other words, this data is like an uncut diamond that awaits careful polish.
This is where GIS comes in! With the GIS software, all collected coordinates can be placed across a map of the area under study to be analysed. The software organises data in an orderly manner to show the areas where there is a concentration of Sloth bears, locations where conflicts are likely to occur and places where human and bear mortality are high.
![The team at Jammu & Kashmir relied on GIS to study human-bear conflict in the region. [Photo (c) Wildlife SOS]](https://wildlifesos.org/wp-content/uploads/2022/04/Brown-bear-project-survey.jpg)
As part of the Brown bear study undertaken by Wildlife SOS in Jammu and Kashmir, the research team utilised GIS to study human-Brown bear conflict. The team divided the study area into small units and located the centroid of each unit using the platform of QGIS (or Quantum GIS). Through interviews with the local people, camera trap footage and analysis of Brown bears’ tracks, the team was able to collect a wealth of data on high conflict locations, age and sex of humans involved, the activity being undertaken by the victim of conflict, the details of the Brown bear in question and more. By entering the information gathered from villagers and direct observation into the GIS program, the team of researchers were able to map areas where it was most likely for humans and Brown bears to interact.
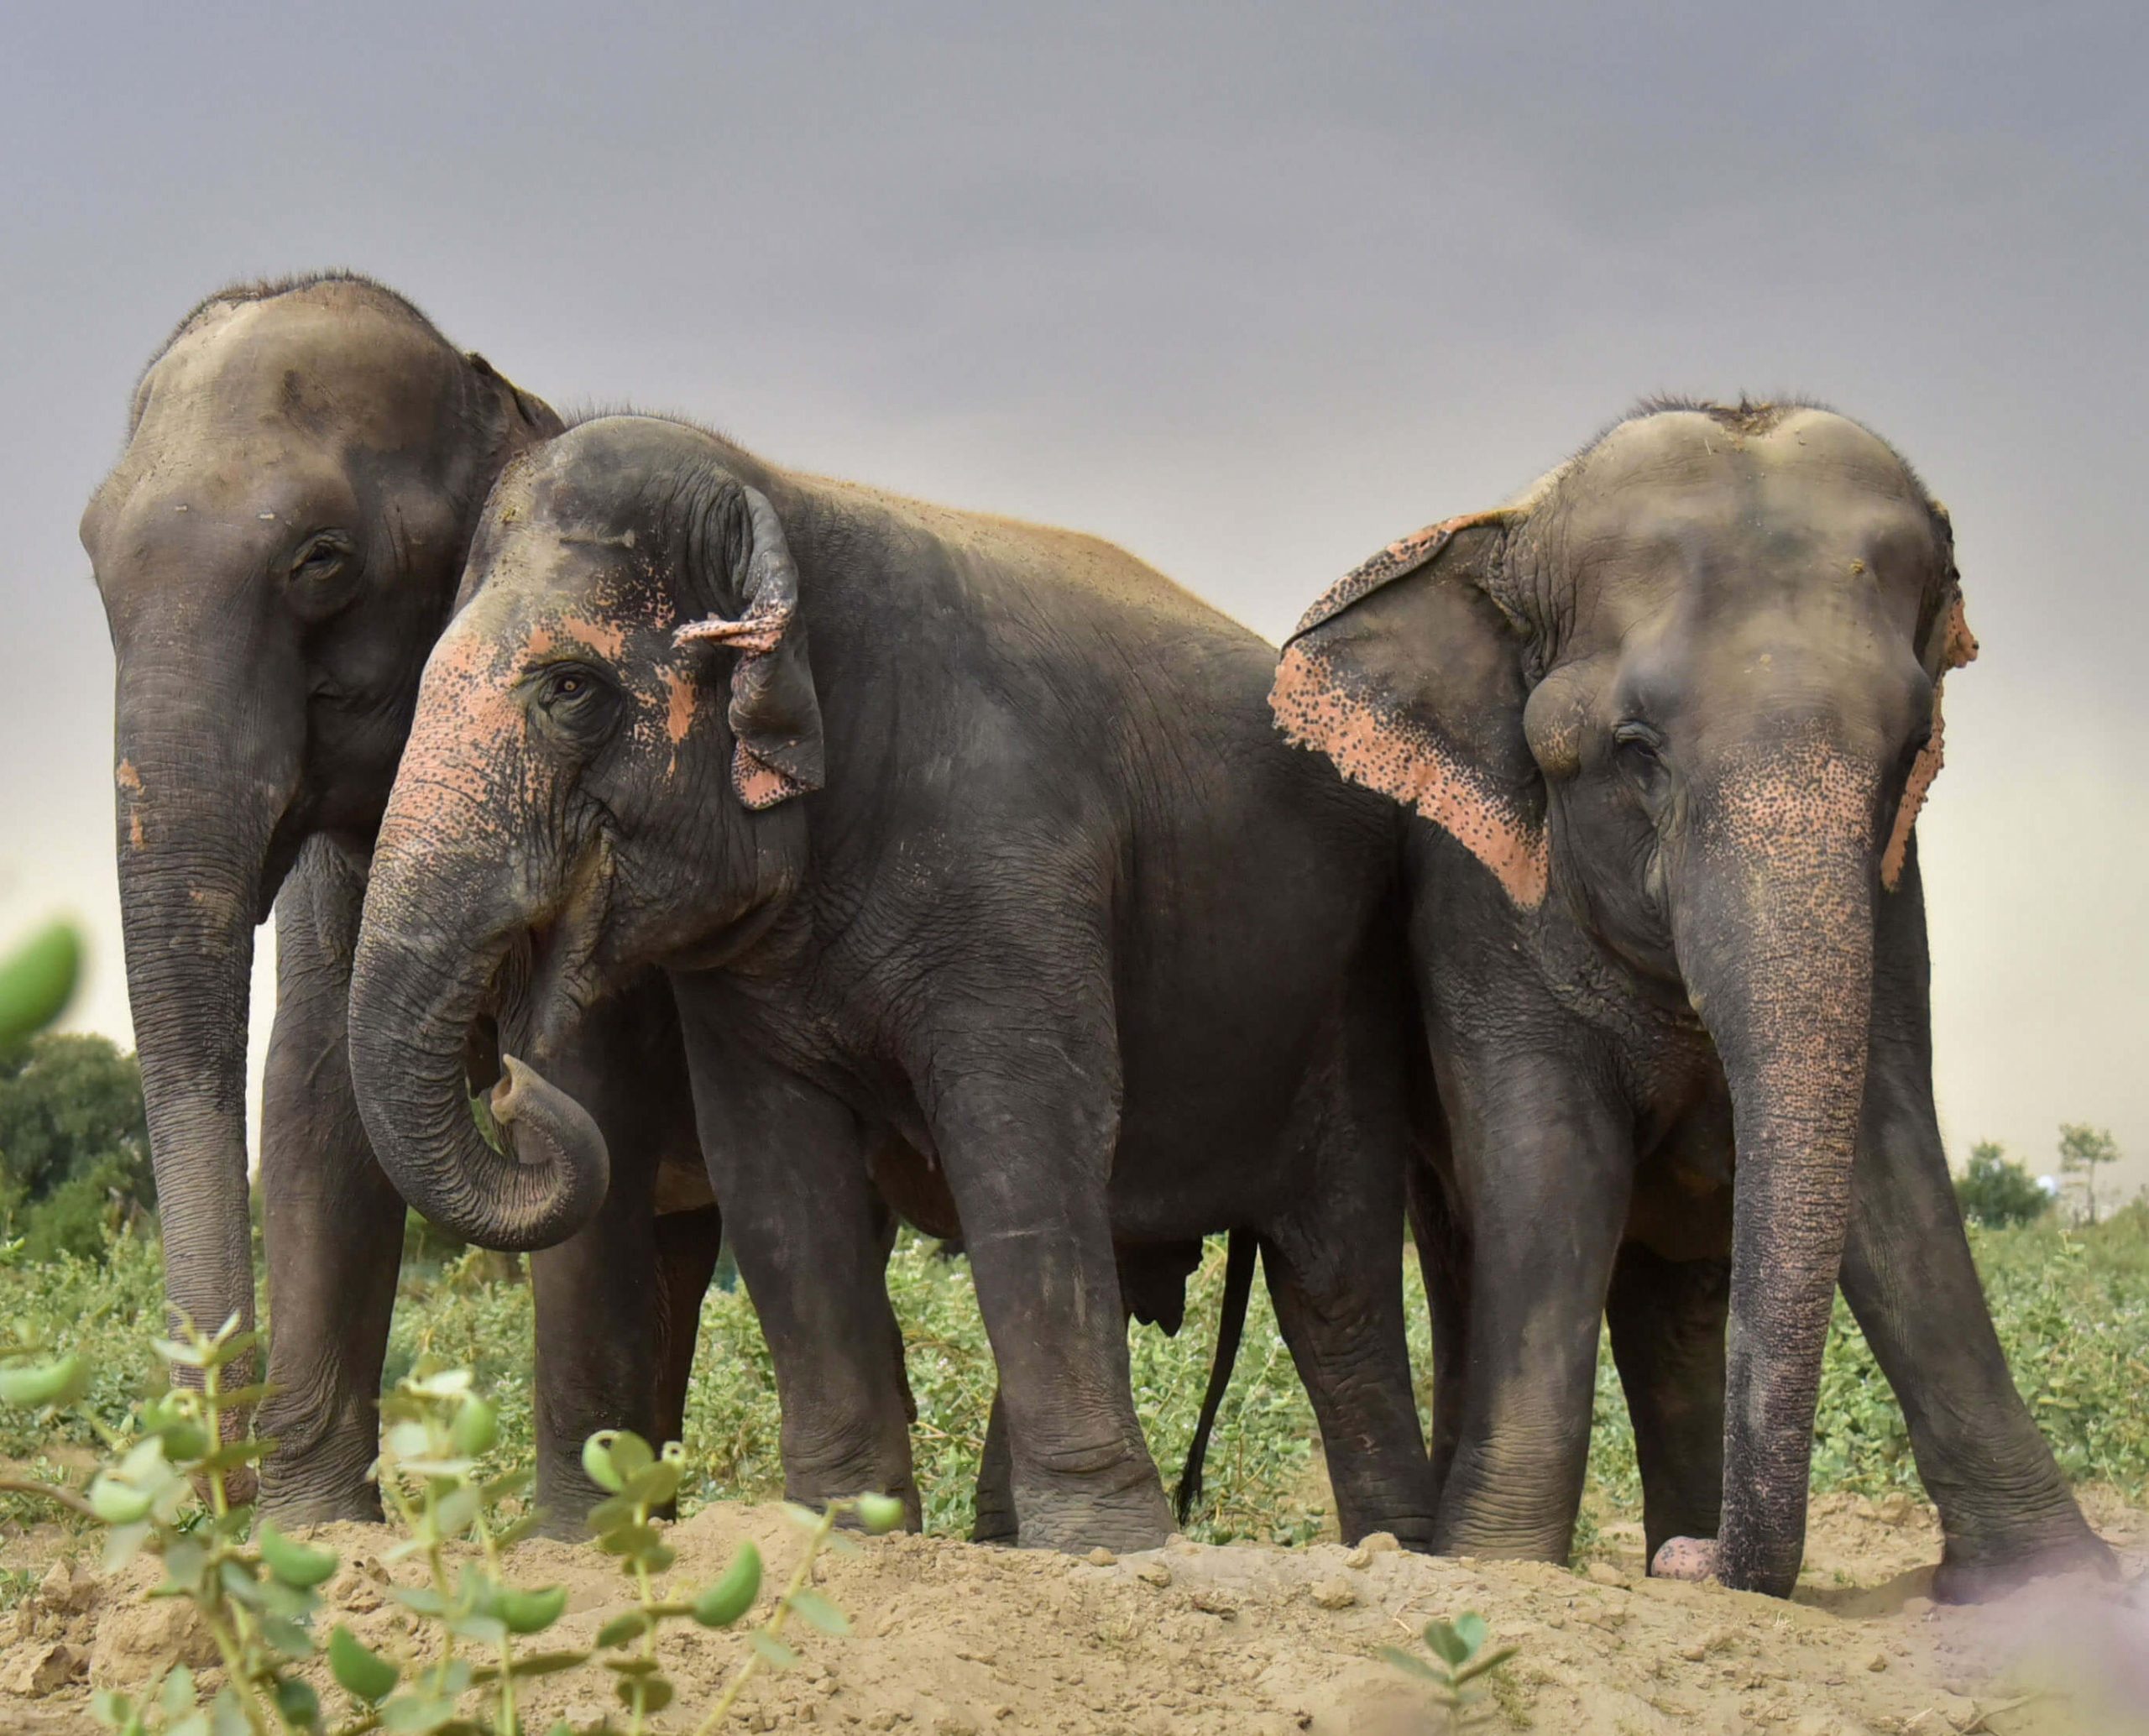
GIS was used in another project that followed the radio-collaring of a wild elephant in Chhattisgarh. The team identified a herd that was repeatedly entering human habitats and engaging in fatal conflict situations. A decision was taken to radio-collar the matriarch of the herd. The matriarch, named Van Devi, was leading the herd during migration, and to radio-collar her meant identifying the location of the entire herd. The data collected from her radio collar was analysed with GIS, which helped in predicting the movement of the herd. With GIS, the research team, as well as the Chhattisgarh Forest Department, were promptly updated on the herd’s location.
![GIS was utilized during the radio-collaring of a wild elephant by Wildlife SOS at Chhattisgarh. [Photo (c) Wildlife SOS/Lenu Kannan]](https://wildlifesos.org/wp-content/uploads/2022/01/van-devi.jpg)
This tool has helped in creating an Early Warning System (EWS) through which information on the path of the elephant herd is sent out to people well in time via SMS or WhatsApp messages. This process has significantly reduced mortalities from human-elephant conflict.
There are many other places within the field of wildlife where GIS proves to be invaluable. To create better policies for the protection of endangered species, researchers can rely on data about where these species are most frequently found. Once this data is collected, it can be laid across a map to identify hotspots that are most crucial for the survival of these species. With clarity on this, protected wildlife areas like reserves and sanctuaries can be developed. GIS allows us to study our environment and understand the impact of natural disasters like forest fires, landslides, and earthquakes, among others.
The Wildlife SOS research team continues to track and study wild animals of India to assist policy makers who can finalise legislations to protect these animals. If you too wish to contribute to our efforts, please donate here.
To know more about Wildlife SOS’ research publications, click here.